Serving Daytona Beach, Ormond Beach, Port Orange, Palm Coast and Surrounding Areas
Lynn Byrne, Realtor
386-566-7503
- Search
- Sail Boats
- K
Daytona Beach Homes Market Report
September 14, 2009
Welcome to the weekly market report for real estate in Daytona Beach, Florida. In this report, we focus on what's happened over the past week. The purpose of this page is to give a quick update of the Daytona Beach, Port Orange and Ormond Beach real estate markets.
Lynn and David's Activity Level
It's been busy week, but things have slowed down a bit. I spent the weekend attending an American Cancer Society training session in Orlando. I co-chair of the annual fund-raising event for the Daytona area. We are still spending a lot of time on follow-up on short sale deals approved by the banks. I had to make calls everyday for over a week to one bank. Finally, they found our documents filed in the wrong folder. My point is that with short sales, persistence is required until the deal is closed. Please make sure that if you are going to pursue Ormond Beach, Port Orange or Daytona Beach short sales, that the agent you choose has the necessary experience and persistence to see you through the whole process.
We still have a lot of short sale contracts in with banks. I spend more than one day a week following-up on progress. Then once the deal is approved, I spend a lot of time making sure that the deal goes through for the buyer and seller. Believe me, these things are not automatic and take a lot of follow-up and persistence. The contact at the banks can be difficult to reach and returning messages is often neglected. It figures because they are simply overwhelmed. Most buyers are aware, but still it's frustrating.
My activity this year is through the roof, but I'm not complaining. There a lot of inquiries from the web site. I'm getting new calls and email inquiries nearly every day. I've been working with buyers in all price ranges and recently more people are looking in the $200,000 range and above, but most sales are still in the lower price ranges. We had one closing at $335,000 a few weeks ago and another at over $500,000 two weeks ago.
Over 75% of July sales from the MLS were under $200,000, but that number dropped to 70.7% for August. One month is not a trend, but it's good to see a higher percentage of sales in the higher price ranges. Sales in August came in at 335 homes and dropping from July's three year high of 375. Last year the high sales month was in July as well. We'll see how sales go for the rest of the year.
Prices are attractive for many people, but really low priced properties are a little deceptive. Daytona Beach REO properties are often selling for more than listed. These properties are priced low to attract attention and then create a bidding war. The REO agents will state, give us your one and best offer by a certain date, we have multiple offers above listing price. Buyers need to be careful that they understand they value of properties when crafting their offers.
Bargains are out there, but it's important to know what you're looking for. There are still over 5,500 homes and condos on the market. There's even South Daytona Condos available for under $30,000. 1,034 sq. ft. for under $28,900. That's $27.95 per square foot. Nothing can be built for near that price. Incredible. Recently, some two-bedroom, two-bath units came on the market at under $20,000.
Distressed properties are most of the market in our area now. Nationwide, the number is 30-45%, but here it's much higher. Estimates have been published of 66% in the Volusia / Flagler area. Buyers are looking for bargains. REO properties and short sale markets are selling. The traditional home sale, where the owner is not in financial distress is not selling unless it's priced to compete with the distressed properties. Sellers in that position are unwilling to drop the prices to the level of the short sale and REO prices. The homes that are not in distress are what is often referred to as market value. We believe true, current market value, is what is being set by the short sales and REO sales. Until these homes clear the market, prices for Daytona Beach, Ormond Beach, Port Orange real estate and the rest of the area will stay low.
Interest rates have risen recently and we believe they won't stop soon. There will be fluctuations, but we see inflation pressures building and when the economy rebounds a bit, those pressures will be released and inflation will rise. The US Government cannot continue to print money and borrow to fund new programs without causing inflation to rise.
Weekly Homes Sold Report
This Week Homes Sold Report
| Period | Homes Sold |
|
Week Before (8/29- 9/4) |
75 |
|
Last Week (9/5- 9/11) |
63 |
|
Last Month (8/5- 8/11) |
75 |
|
Last Year (9/5/ - 9/11) |
32 |
Month To Date Homes Sold Report
| Period | Homes Sold |
| This Month (Through Sep 11) | 112 |
| Last Month (Through Aug 11) | 111 |
|
Last Year (Through Sep 11) |
79 |
Year to Date Daytona Beach Homes
| Period | Homes Sold |
| This Year (January 1 - Sep 11, 2009) | 2558 |
|
Last Year (January 1 - Sep 11, 2008) |
2093 |
(Note: There is a delay of a few day in entry of homes sales by some agents so current reported numbers are generally a little lower than actual, but we believe reporting the most current numbers gives a good trend indicator.)
Homes Sold Analysis
It's been a better year than last year and July sales were the highest in over three years. 377 homes and condos were sold through the Daytona Beach MLS in July. August sales of 335 properties were lower than July, but 20.9% higher than August of 2008 (277 sold). With 112 properties sold through Friday, we are off to a better start than last September when a total of 233 properties were sold.
We are now 465 properties ahead of last year's sales pace. To put that in perspective, January and February sales last year combined were 386 properties.
What happens next depends on how people view prices and economic conditions. If you are considering financing your purchase, I urge you to check out Mortgage Rates are a Game Changer for Daytona Beach Real Estate. Interest rates are so low, that when they rise, you could pay more on a monthly basis on a $180,000 mortgage than you would on a $200,000 mortgage. Check it out. No long ago Warren Buffet said that Americans need to prepare for 1970's style inflation. If you will be financing, you could be in a great position when mortgage rates jump.
Banks are still making it tought to borrow. A credit union recently made a client show that they had proof of funds to pay off the entire mortgage. Banks were bailed out, so they don't need to lend - yet. They will eventually. When mortgage money does become more available, it may signal a bottom to the market. To buy close to the bottom, you will need to be working with someone who is actually in the market every day and knows what's happening. That's where I come in. I have the patience to work with you through this market. Is that important? I believe it is because there are no clear signals being reported that you will be able to act on. You will need to get a clear idea of the market and the only way to do that is to be engaged. Call me now (386-566-7503) to discuss a plan of attack that meets your needs.
There are tremendous bargains out there. Maybe you shouldn't buy right now, but, you should be looking to get a real idea of what's available. Whether you're an investor, looking for a second home, or looking to move to the Daytona Beach area, you have an opportunity to get the best prices we will see for a long time.
Current Mortgage Rates
|
|
Today |
Last Week |
|
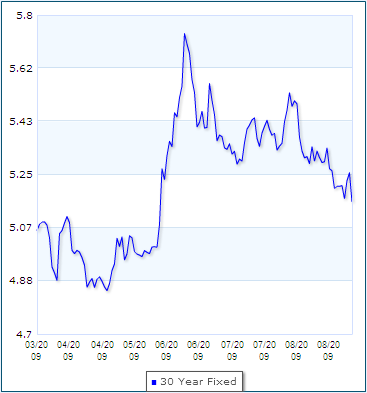
30 YR Fixed |
5.16% |
5.21% |
|
15 YR Fixed |
4.67% |
4.67% |
|
5/1 ARM |
4.32% |
4.35% |
Mortgage rates were mixed during the past week, and are still low, at least in the short term.
The question is, how long will they last? From the chart below, mortgage rates have jumped since late May, but are heading lower again and are much lower than the 6.41% we saw late last year. Rates are probably going to swing until the economic situation is resolved. That can be seen clearly in the 3 Month Interest Rate Chart below. Rates are swinging based on financial markets. However, availability is more important than rates at this time.
First time homebuyers, and that means anyone who has not owned their primary residence over the past three years, should check out our First Time Home Buyer Tax Credit video to see if your eligible for up to $8,000 in tax credits from the federal government. With prices and interests rates, this additional $8,000 could make it wise to purchase now or help grown children get into their first home or condo. This credit expires on December 1st, 2009. The clock is ticking.
Looking at the chart, we may have reached the bottom. We firmly believe rates will go up as the economy improves. Watch this very carefully if you are planning to finance your home purchase.
We have been concerned with long-term inflation for a long time. Mr. Buffett agrees and many other will soon follow. Much against what many pundits are saying, we remain very concerned about long term inflation, especially with the cost of the bailout. The Congressional Budget Office released an estimate of $9 Trillion in deficits during the Obama Administration. These costs will need to paid for in the long run and that means higher taxes and inflation. President Obama is already hinting at tax increases. The Millken Institute has estimated that as much as $7.5 trillion will be spent or committed in the form of loans and payouts before the mess is over. This is more than double the total budget for the US Government. Now, how are we going to pay for that? The Chairman of the Federal Reserve is an academic who has been quoted as saying that the US has a money printing press to keep us out of trouble. We will pay for this mess through high taxes, inflation or both. Inflation is more politically acceptable than higher taxes, so that's our bet. We have advised to watch the mortgage rates carefully if you plan to finance. What's the impact of increased mortgage rates? It's over $130.00 per month on a $200,000 mortgage for a 1% increase. That translates into higher payments, or less home for the same payment. Of course, with rates falling, you would have saved over $117 a month with the 0.9% drop. Please watch these numbers. We publish them here weekly.
Home Inventory Numbers
|
Period |
Residential Inventory |
| This Week | 5472 |
| Last Week | 5437 |
| Beginning of 2009 | 5,656 |
Inventories have been consistent at around 5500 this year, but because of higher sales, total months of inventory have decreased to 16.3 months based on August sales. This is still a big time buyer's market, but less so than last year and down from 26.4 months in January.
Inventory in months is lower for the under $200,000 market segment and extremely high for high priced homes over $300,000. We will continue to monitor the rates as they are a key factor in determining months of inventory on the market. An idea to consider - the inventory is bloated by sellers who have not priced to the current market. If we remove those properties, we have many fewer homes that are priced for the market. We don't know what that number is, but my best guess is over half of homes are currently over-priced.
The inventory level in months declining is one of our keys. Watch this number carefully. More decline signals more market strength. A 20% drop since the beginning of the last year is a positive sign, but we need rates at about 3600 properties or lower before we can call a stable market. Note that inventory in months is quite different for different price points.
Recent Real Estate News of Note
Daytona Beach Homes Sales Up 25.2% in July
Quick report on July 2009 Daytona Beach homes sales, including a break-down by price range.
If you have other information you would like to see as part of the Daytona Beach Real Estate Market weekly report, please send me a message and let me know. The following information is presented to give you a quick idea of the current state of the Daytona Beach Home and Condo market including homes sold, home inventory mortgage rates and real estate news of note. The market report includes Daytona Beach, Ormond Beach Real Estate, Holly Hill Real Estate, South Daytona Real Estate, Ponce Inlet, Wilbur by the Sea, and Ormond by the Sea. We will soon be creating a monthly reports for Palm Coast Real Estate including Flagler Beach.
Categories
- Daytona Real Estate Home
- Daytona Beach Homes for Sale
- Daytona Beach Condos
- Daytona Beach Property
- Ormond Beach Real Estate
- Ormond Beach Condos
- Port Orange Real Estate
- Palm Coast Homes
- Our Property Listings
- Search Homes & Condos
- Market Reports
- ---> Daytona Beach Market Analysis
- Tools
- Rentals
 RSS Feed
-

Lynn Byrne, Realtor
386-566-7503
888-519-9579 -

Member
Ormond Beach Chamber of Commerce

Member
National Association of Realtors
Lynn Byrne, Realtor
386-566-7503
![]()
EXIT Realty of Daytona
211 E International Speedway Blvd
Daytona Beach, FL 32118
Privacy | Site Map
Copyright © 2008. Lynn Byrne Daytona Beach Realtor all rights reserved